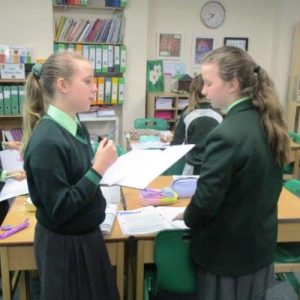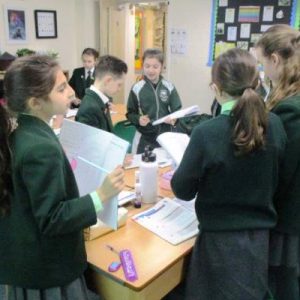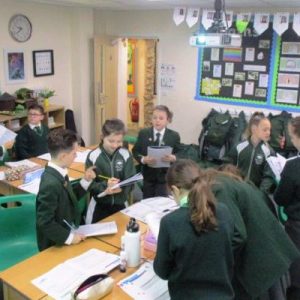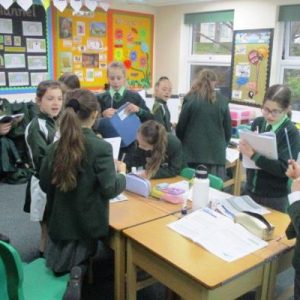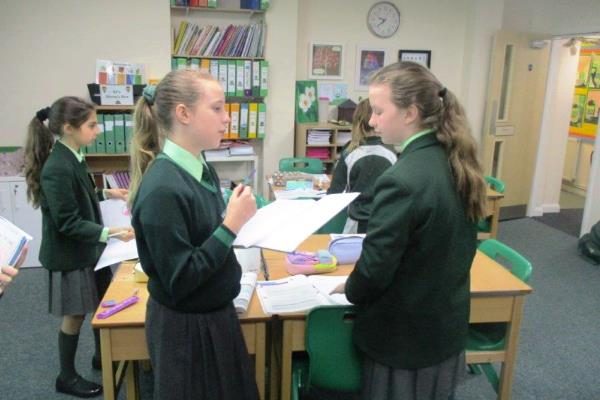
Year 6 pupils have been working on collecting data for a class survey. They then had to solve problems related to the data they collected. This was a very good lesson where the children learned how to present data in different ways by illustrating the results in a bar graph.